Pathview for KEGG
Cordeliers Artificial Intelligence and Bioinformatics
Source:vignettes/pathview.Rmd
pathview.Rmd
An additional analysis is given by the Pathview package
Pathview is an R tool used to visualize gene expression data on biological pathways (from KEGG), it helps for seeing how the genes of interest are involved in known cellular processes like the cell cycle or apoptosis.
To create the cell cycle graph, we use the function
pathview. The expected input for this function is a vector
of the log2FoldChange of the DE genes.
If you want to use this notebook for your projects, it is available here
Pre-processing
In this page, you will only see the specific code to get the graph. The first steps are the same for every visualization. Before the next cells of code, you will need to do all the pre-processing analyses, until the diffexp. If you want to see the code, you can copy/paste it from the other pages
This is what you get after the diffexp:
head(diffexp_mac)## baseMean log2FoldChange lfcSE pvalue padj
## APOL4 5887.5938 -8.818579 0.2916117 3.274201e-202 5.448598e-198
## IRF1 24174.0232 -5.574286 0.1981052 1.753034e-175 1.458612e-171
## GBP2 22916.8387 -6.745890 0.2842869 8.337955e-126 4.625064e-122
## NUB1 4724.1036 -2.512001 0.1114432 1.184070e-113 4.926026e-110
## P2RY14 2823.4865 -9.472854 0.4545084 1.962633e-97 6.532034e-94
## AIM2 704.0959 -7.993436 0.3906515 6.399021e-94 1.774768e-90Conversion
The next cell will take the log2FoldChange and ENTREZID to get the
expected object for the pathview function.
#|message: false
library(org.Hs.eg.db)
library(dplyr)

# Retrieve the gene symbols from the row names of the differential expression data
gene_symbols <- rownames(diffexp_mac)

# Convert gene symbols to Entrez IDs using the org.Hs.eg.db annotation database
conversion <- AnnotationDbi::select(
  org.Hs.eg.db,                   # Human gene annotation package
  keys = gene_symbols,            # List of gene symbols to convert
  columns = c("ENTREZID"),        # We want to retrieve Entrez IDs
  keytype = "SYMBOL"              # Input key type is gene symbol
)

# Add gene symbols as a new column in the expression data
diffexp_mac$SYMBOL <- rownames(diffexp_mac)

# Merge the differential expression data with the Entrez ID conversion table
diffexp_mac <- dplyr::left_join(diffexp_mac, conversion, by = "SYMBOL")

# Create a named vector of log2 fold changes using Entrez IDs as names
gene.data <- diffexp_mac$log2FoldChange
names(gene.data) <- diffexp_mac$ENTREZID

# Remove entries with missing Entrez ID names
gene.data <- gene.data[!is.na(names(gene.data))]

# Display the first few elements of the vector
head(gene.data)
## 80832 3659 2634 51667 9934 9447
## -8.818579 -5.574286 -6.745890 -2.512001 -9.472854 -7.993436Graph
Once done, we can call the function with specific parameters that match our dataset.
#|message: false
pathview(
gene.data = gene.data, # Named vector of log2FoldChange values for DE genes
pathway.id = "hsa04110", # KEGG pathway ID
species = "hsa", # Species code for Homo sapiens
gene.idtype = "entrez", # The type of gene IDs used in gene.data
out.suffix = "macrophage_apoptosis", # Name for the output files
low = "lightgreen", # Color for low log2 fold change values
high = "pink", # Color for high log2 fold change values
na.color = "gray", # Color for genes not mapped or without data
kegg.native = TRUE
)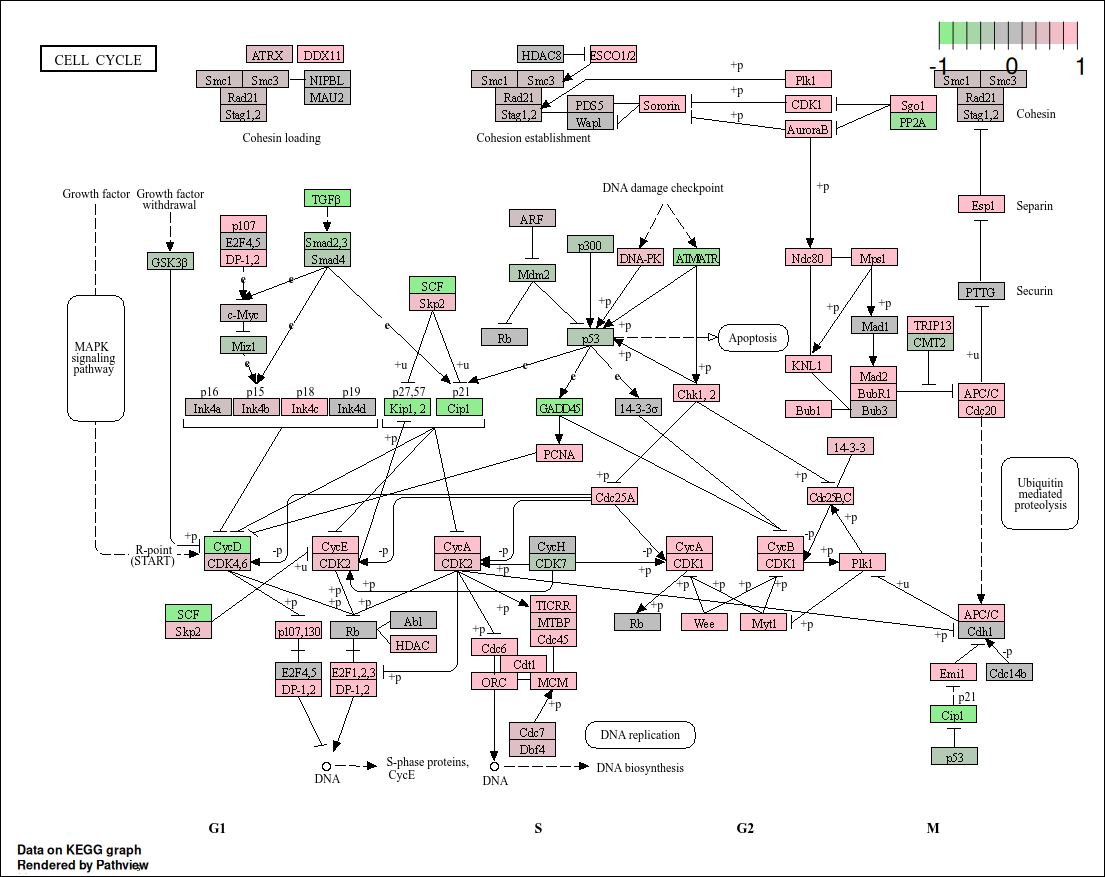 Using the
 pathview package, we visualized the impact of
differentially expressed genes from the macrophage dataset
on the KEGG apoptosis pathway (hsa04110). The pathway
diagram highlights genes based on their log2FoldChange
values: upregulated genes are shown in pink (Cdc25a,
CycA, CycB, …), while downregulated genes appear in
light green (GADD45, Cip1, CycD, …). Genes with no expression data or
missing values are colored gray. This visualization allows us to assess
how the IFN-γ treatment influences components of the
apoptotic signaling cascade, helping to identify specific regulatory
points potentially activated or suppressed in response to the
stimulus.